Monitoring Scraping Systems: What to Track Before Things Break
One of the biggest misconceptions about scraping infrastructure is that if requests are succeeding, everything must be working.
On the face of things, that sounds reasonable. If requests are succeeding, data is arriving where it’s supposed to, and nobody’s receiving alerts, it’s easy to assume the system is healthy.
Scraping pipelines rarely announce that something is wrong, though. More often, issues develop gradually. A site update causes certain fields to be extracted less consistently, response times start increasing, or success rates begin trending downward over time. None of these changes are significant enough to stop the pipeline immediately, which means they can easily go unnoticed during day-to-day operations.
When someone eventually spots a problem in a dashboard, a report, or a downstream application, the underlying issue has often been present for much longer than expected. That’s why monitoring isn’t just about detecting failures. It’s about identifying unusual patterns early enough to investigate them before they start affecting the quality and reliability of the data you’re collecting.
This is why monitoring matters so much.
Good monitoring gives teams a chance to investigate unusual behavior before it starts affecting the systems and people that depend on the data. When trends are visible early, it’s much easier to fix issues while they’re still small rather than discovering them later through broken dashboards, inconsistent reports, or unhappy customers.
As scraping operations grow, monitoring becomes less about watching individual scrapers and more about understanding the overall health of the entire data collection ecosystem.
Keep Scrapers Running
Reliable proxies and infrastructure for stable data collection.

Why Scraping Systems Fail Differently Than Traditional Applications
Monitoring a scraping system is very different from monitoring a traditional software application.
In a typical application, failures are usually obvious. A service goes offline, a database becomes unavailable, or an application crashes completely. When that happens, alerts fire, dashboards turn red, and teams know there’s a problem that needs attention.
Scraping pipelines rarely behave that way. A scraper can continue running for days while the quality of the data gradually deteriorates. Requests might still return successful responses, but certain fields are extracted incorrectly, page layouts start causing inconsistencies, or important pieces of information stop appearing in the output altogether. From an infrastructure perspective, everything can look perfectly healthy while the value of the dataset steadily declines.
That’s what makes monitoring scraping systems more challenging. Looking at infrastructure metrics alone only tells part of the story. Teams need visibility into the data itself, how consistently fields are being extracted, how outputs compare over time, and whether the information being collected still reflects what’s happening on the target sites. Without that broader view, it’s easy for problems to hide in plain sight while the pipeline continues doing exactly what it was told to do.
Why Success Rate Is Still One of the Most Important Metrics
Success rate is usually one of the first places teams look when they’re trying to understand the health of a scraping system.
When request failures start increasing, there’s normally something worth investigating behind it. A website may have changed how it handles traffic, new protections may have been introduced, or there could be an issue somewhere in the infrastructure supporting the workload. Whatever the cause, changes in success rate often provide one of the earliest signals that something in the environment isn’t behaving as expected.
What matters most is how that metric behaves over time. Looking at a single day’s performance rarely tells the full story, especially in larger scraping environments where small percentage changes can represent a significant volume of requests. A drop from 99 percent to 98 percent success may not look dramatic on a dashboard, but across millions of requests it can create additional retries, slower refresh cycles, and larger operational workloads for the systems downstream.
That’s why experienced teams tend to focus less on individual snapshots and more on long-term trends. The direction a metric is moving often reveals far more than the number itself.
Why Latency Deserves More Attention
Latency doesn’t always get the same attention as success rate, largely because a slow request still counts as a successful request. If data is arriving and jobs are completing, it’s easy to assume everything is working as expected.
In practice, response times often tell an important story about the health of a scraping system. When websites start responding more slowly, infrastructure comes under heavier load, or traffic distribution becomes less efficient, those changes frequently appear in latency metrics before they show up anywhere else.
The reason latency is so useful is that it tends to move gradually. Instead of a sudden spike that immediately triggers an alert, teams often see response times creeping upward over days or weeks. Looking at those trends can help uncover emerging performance issues while the pipeline is still operating normally, giving teams time to investigate before throughput, refresh cycles, or downstream systems start feeling the impact.
For workloads where fresh data matters, keeping an eye on latency is every bit as valuable as watching request success rates.
Why Data Quality Metrics Matter Just as Much
Data quality is one of the easiest things to overlook when monitoring a scraping system, partly because infrastructure metrics tend to get most of the attention.
Imagine a product scraper that continues loading pages successfully but suddenly stops extracting prices from part of the page. From an operational perspective, everything might appear normal. Request success rates remain high, pages continue loading correctly, and the infrastructure shows no obvious signs of trouble. Meanwhile, one of the most valuable pieces of data has disappeared from the output.
Situations like this are surprisingly common, which is why monitoring the data itself deserves just as much attention as monitoring the systems collecting it. Looking at field completion rates, extraction consistency, record volumes, and schema changes helps teams spot issues that traditional infrastructure metrics simply won’t reveal.
Changes in data quality are often one of the earliest indicators that something has changed on the target website. The sooner those changes become visible, the easier it is to investigate them before they start affecting reports, analytics, models, or customer-facing products.
Watching for Structural Changes
Websites rarely stay the same for long. Retailers update product pages, marketplaces redesign listing layouts, and search engines regularly introduce new features that change how results are displayed. Most of these updates are made with users in mind, but they can have a significant impact on scraping pipelines that depend on a consistent page structure.
That’s why many teams keep an eye on structural consistency as part of their monitoring strategy. When page layouts, HTML structures, or extraction patterns start looking different from what the system has seen historically, it’s often a sign that a closer inspection is needed.
Detecting these changes doesn’t always require sophisticated machine learning models or complex automation. In many cases, comparing current outputs against historical versions is enough to highlight meaningful differences before they start affecting data quality more broadly.
Not every front-end update deserves an alert, of course. What matters is understanding which changes are likely to affect extraction reliability and surfacing those early enough that teams can investigate before they start creating gaps or inconsistencies in the dataset.
Why Retry Rates Tell an Important Story
Every scraping system experiences occasional failures. Networks become congested, requests time out, and websites sometimes respond unpredictably. Well-designed retry logic helps smooth over these temporary issues so the pipeline can continue operating without interruption.
What tends to be more interesting from a monitoring perspective is how retry behavior changes over time. If a workload that normally requires very few retries suddenly starts generating significantly more, it’s often a sign that something in the environment has changed. A target website may be handling traffic differently, infrastructure performance may be under pressure, or requests may no longer be distributed as effectively as they were before.
This is one reason retry metrics are worth watching closely. In many cases, they start moving in the wrong direction before larger problems become visible elsewhere in the pipeline. A gradual increase in retry volume can provide an early indication that performance, reliability, or data collection quality deserves a closer look, even when success rates still appear healthy.
Scrape at Scale With Chromium Stealth Browser
Self-hosted, Linux-first, compatible with all automation frameworks.
Why Geographic Accuracy Should Be Monitored
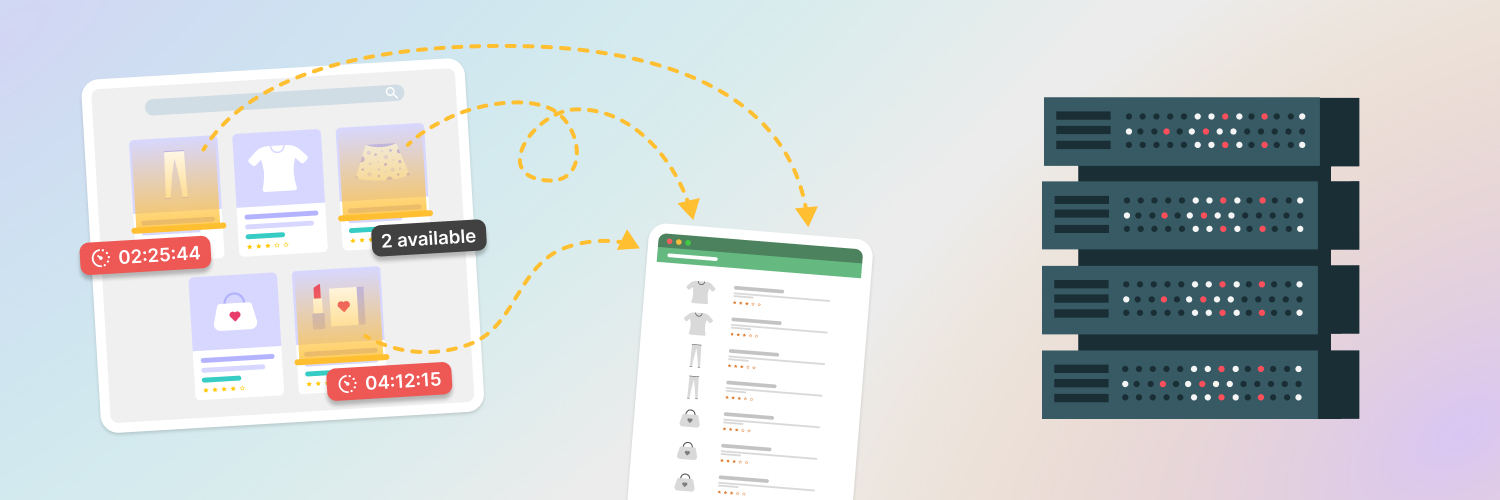
Location plays a huge role in the accuracy of many scraping workloads. Search rankings, product prices, travel availability, marketplace listings, and local search features can all change depending on where a request originates. If requests start appearing from the wrong region, the data being collected may still look valid on the surface, but it no longer reflects the market the team is trying to monitor.
That’s why geolocation is worth monitoring alongside more traditional infrastructure metrics. It’s useful to know that requests are succeeding, but it’s equally important to know they’re being recognized in the correct location and that IP mappings remain consistent over time. A search monitoring platform tracking rankings in Chicago, for example, won’t get much value from results that are accidentally being served as if the request came from another city or state.
Issues like these don’t always trigger obvious alerts, but they can have a significant impact on data quality. Keeping an eye on geolocation accuracy helps teams catch those problems early and maintain confidence that the datasets they’re collecting still represent the audiences, regions, and markets they’re intended to reflect.
Why Monitoring Volume Can Reveal Hidden Problems
Keeping an eye on record volume can reveal issues that aren’t always obvious from success rates alone. If a scraper normally collects 100,000 records a day and that suddenly drops to 80,000, something has changed, even if requests are still completing successfully and the infrastructure appears healthy.
Sometimes the explanation is straightforward. A target site may have removed content, changed its structure, or updated the way information is displayed. In other cases, the cause is harder to spot and might relate to extraction logic, missing fields, or changes that only affect part of the dataset.
Volume trends become especially useful when you’re monitoring large numbers of targets. A problem affecting a single site might be easy to miss in isolation, but unusual changes in aggregate record counts often highlight that something within the pipeline deserves a closer look.
Record volume won’t tell you exactly what’s wrong, but it often provides one of the earliest signs that something has changed. When it’s viewed alongside metrics like success rates, latency, and data quality, it becomes much easier to understand the overall health of the system.
The Importance of Looking at Trends Instead of Snapshots
It’s easy to get drawn into whatever a dashboard is showing right now. Success rates look healthy, latency appears normal, and request volumes are sitting where you’d expect them to be. That’s useful information, but a single snapshot only tells you what the system looks like at that moment in time.
Some of the most interesting signals only become visible when you zoom out. A success rate that falls by a fraction of a percent each week might never trigger an alert, but after a month or two the difference can be significant. The same applies to response times. A small increase from one day to the next isn’t particularly concerning, but a steady upward trend over several weeks often points to something worth investigating.
Looking at metrics over longer periods makes it much easier to separate temporary fluctuations from genuine changes in behavior. Websites evolve, workloads grow, and infrastructure patterns change over time. Having that historical context helps teams understand whether a system is performing consistently or gradually becoming less reliable.
That’s often where the most useful monitoring insights come from. Not from what’s happening today, but from understanding how today’s numbers compare to where the pipeline was last week, last month, or even six months ago.
Why Monitoring Gets More Important as Scale Increases
Manual monitoring works surprisingly well when a scraping project is still relatively small. Teams can review sample outputs, spot-check pages, and usually identify unusual behavior without too much difficulty. When the workload expands across hundreds or thousands of targets, though, that approach becomes much harder to sustain.
Larger scraping environments generate more activity than any individual or team can realistically keep track of. Websites are updated constantly, request volumes increase dramatically, and the data being collected often feeds multiple systems at once, from analytics platforms and dashboards through to machine learning models and customer-facing products.
As that complexity grows, monitoring becomes less about watching individual scrapers and more about surfacing the handful of signals that genuinely deserve attention. The goal is to make unusual patterns visible quickly, whether that’s a drop in record volume, an increase in retries, or a gradual decline in extraction quality.
Without that visibility, teams often end up spending far too much time searching for the source of a problem. Strong monitoring makes it easier to focus on what’s changed, why it’s changed, and what needs to happen next.
Working with Rayobyte
At Rayobyte, we’ve worked with enough large-scale scraping systems to know that reliability isn’t something you discover after a problem appears. The most successful teams invest heavily in visibility long before anything goes wrong.
That’s one reason we focus so much on building stable infrastructure that gives teams better insight into how their scraping environments are performing over time. Reliable proxies, consistent geolocation, predictable browser behavior, and balanced traffic distribution all contribute to cleaner monitoring signals and easier troubleshooting when something changes.
As scraping workloads grow, the challenge isn’t simply collecting more data. The challenge is understanding whether the system collecting that data remains healthy, efficient, and trustworthy week after week.
Monitoring plays a huge role in answering that question. The sooner teams can identify unusual patterns, the easier it becomes to keep pipelines reliable as the web continues changing around them.
Try our proxies now, or get in touch with the team to find out more.
Keep Scrapers Running
Reliable proxies and infrastructure for stable data collection.